ELK
- ElasticSearch 啟動
- Elasticsearch REST Api
- 【Elasticsearch】容量100%
- Elasticsearch search
- 【Filebeat】Mac 安裝
- 【Filebeat】相關連結
- Elasticsearch 查詢語法
- 【Kibana】 使用 https
- 【 錯誤處理】watermark 設定太小導致index 變成唯讀
- 【參數說明】enable_for_single_data_node
- 【常用指令】kibana Dev Tools
ElasticSearch 啟動
Starting Elasticsearch
Starting Elasticsearch | Elasticsearch Guide [7.14] | Elastic
Elasticsearch REST Api
喬叔的 Elasticsearch 基礎實務班 (2021.07.24~25) - HackMD
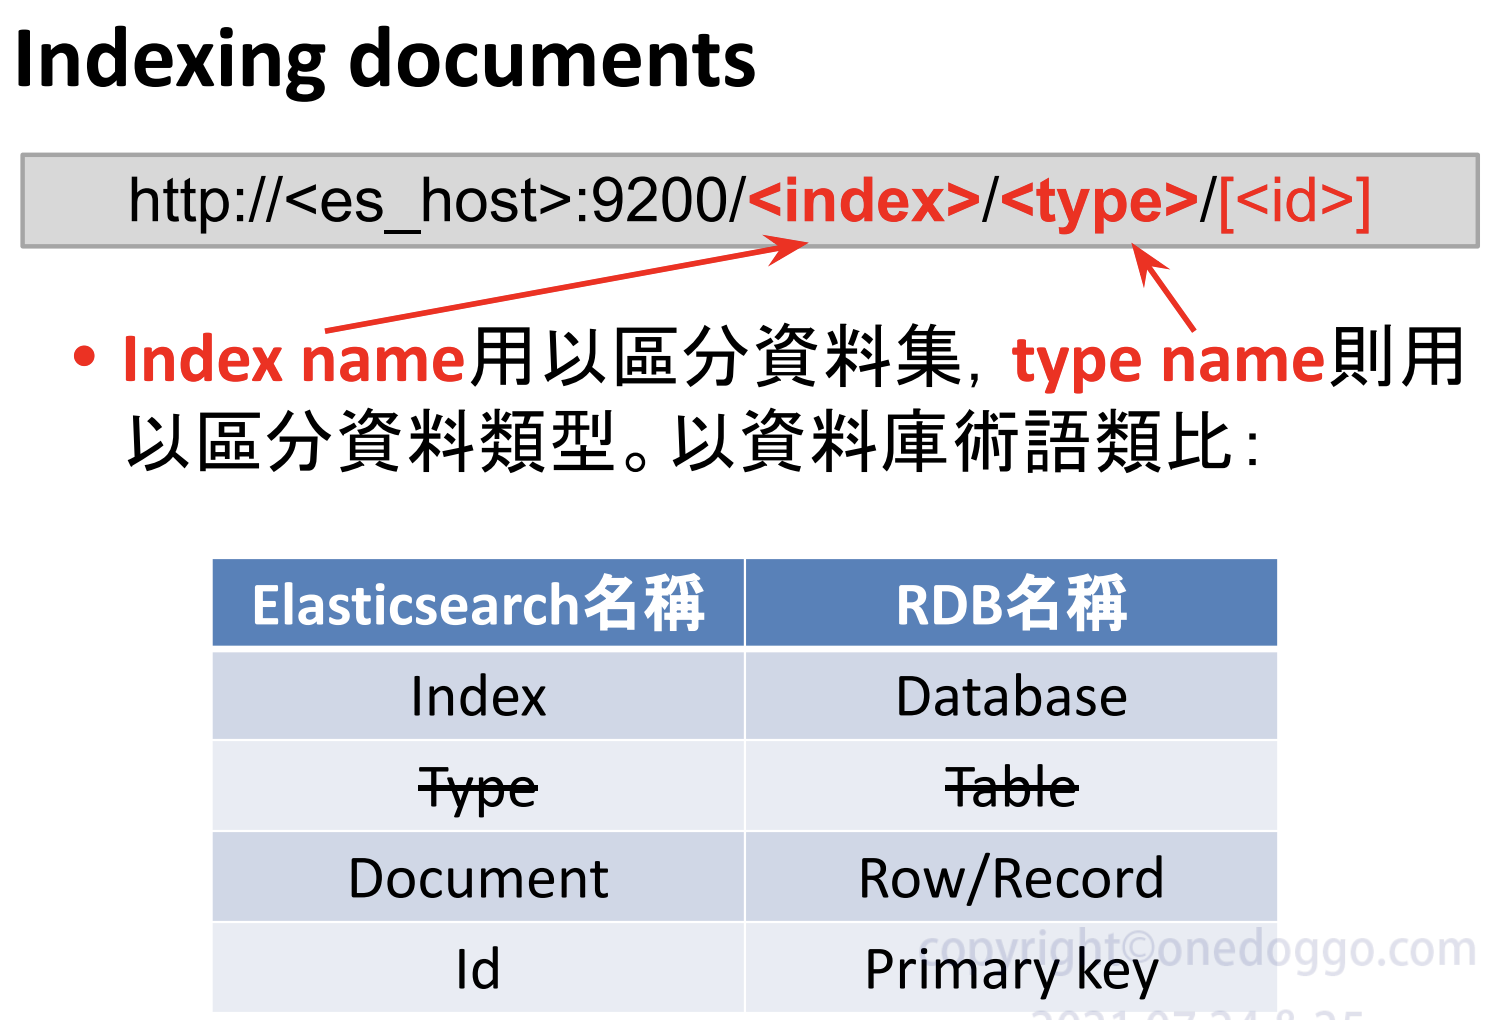
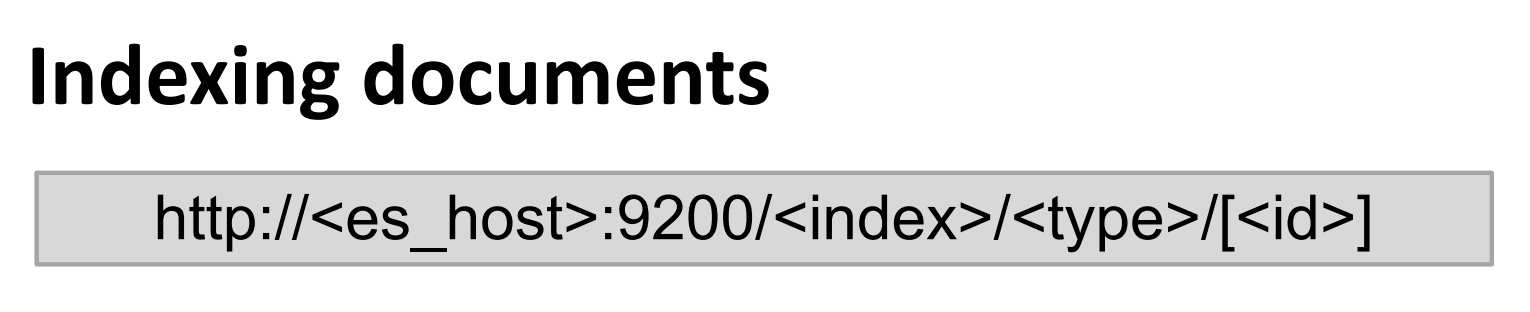
Index與type欄位是必要的,id若省去,Elasticsearch
會為document加上自動產生的id。
– 自動產生的id為22字元長、URL-safe、Base64-encoded
string UUID。
- 若給予的index或type名稱目前並不存在時
,Elasticsearch會以預設設定值自動建立該名稱的
index或type。 - 若不給予id時,index資料應使用POST。
- type 建議使用 _doc (since 6.0)
【Elasticsearch】容量100%
# 替換 <your_elasticsearch_host> 和 <index_name_pattern> 為實際的 Elasticsearch 主機和索引名稱模式

# 列出所有索引
curl -X GET "http://<your_elasticsearch_host>:9200/_cat/indices?v"

# 删除特定模式的索引(例如,以 "log-" 开头的索引)
curl -X DELETE "http://<your_elasticsearch_host>:9200/<index_name_pattern>"

# 删除所有索引(請謹慎使用)
# curl -X DELETE "http://<your_elasticsearch_host>:9200/*"
Elasticsearch search
關於搜尋
Elastic Stack第七重 - iT 邦幫忙::一起幫忙解決難題,拯救 IT 人的一天 (ithome.com.tw)
【Filebeat】Mac 安裝
mac 安裝
https://www.elastic.co/guide/en/beats/filebeat/8.7/filebeat-installation-configuration.html#installation
brew install filebeat
zsh completions have been installed to:
  /usr/local/share/zsh/site-functions

To restart filebeat after an upgrade:
  brew services restart filebeat
Or, if you don't want/need a background service you can just run:
  /usr/local/opt/filebeat/bin/filebeat
【Filebeat】相關連結
Elasticsearch 查詢語法
query
查询一级标签
query
    二级标签
    prefix  wildcard
    constant_score
        filter
    prefix  前缀匹配,文档中的词语以搜索的词汇开头
        {field:value}
	term
	    代表完全匹配,即不进行分词器分析,文档中必须包含整个搜索的词汇
	    {field:value}
	match
	    match和term的区别是,match查询的时候,elasticsearch会根据你给定的字段提供合适的分析器,而term查询不会有分析器分析的过程
        match查询相当于模糊匹配,只包含其中一部分关键词就行
	    {field:value}
	match_all   没有参数,查询出来所有
	    {}
	match_phrase    匹配一个短语,给一个短语词,匹配
        {field:value}
    multi_match     匹配多个字段
        {
          "query": {
            "multi_match": {
              "query": "caoke2",
              "fields": [
                "msg",
                "code"
              ]
            }
          }
        }
	range
	    {"age":{"lt":10,"gt":1}}
	-- 以上两级关键字 不能同时使用 多关键字需要用bool
	bool    布尔查询,匹配多个条件,下面的关键字中可以把上面的再嵌套一遍 bool中不能包含range,要用filter包裹
		must should must_not filter
        多个查询条件用数组包裹
highlight   自定义标签的前后缀,fields 里面的字段要是query中查询的字段
    "highlight":{
        "pre_tags":[
          "<aaa>"
        ],
        "post_tags":[
          "</aaa>"
        ],
        "require_field_match":true,
        "fields":{
          "msg":{
            "fragment_size":1000,
            "number_of_fragments":0,
            "fragment_offset":0
          }
        }
      }
from    查询的结果取范围开始
size    查询的结果取范围结束
sort    排序
      "sort": [
        {
          "age": "desc"
        }
      ]
_source     包含or排除字段
    {"includes":["code"],"excludes":[]}
script_fields
aggs    聚合
    "aggregations":{
        "term_agg":{
          "terms":{
            "field":"age",  对字段分组
            "size":10,      返回的条数
            "order":[{   对返回的结果排序,可以多条
                "min_agg":"desc"
            }]
          },
          "aggregations":{  分组后需要统计,可以多个
            "min_agg":{
              "min":{
                "field":"age"
              }
            }
          }
        }
    }
【Kibana】 使用 https
要在本機環境的 Kibana 自產憑證,並讓 Kibana 支援 HTTPS,而非預設的 HTTP,以下是詳細步驟:
🚀 步驟 1:產生自簽名憑證(Self-Signed Certificate)
🔧 使用 OpenSSL 產生憑證:
- 開啟終端機,執行以下指令來建立一個新的私鑰和自簽名憑證:
mkdir -p /etc/kibana/ssl
cd /etc/kibana/ssl
# 產生私鑰和自簽名憑證,設定有效期限為 365 天
openssl req -x509 -newkey rsa:4096 -keyout kibana-key.pem -out kibana-cert.pem -days 365 -nodes
# 修改擁有者,權限
chown kibana:kibana kibana-key.pem
chown kibana:kibana kibana-cert.pem
chmod 644 kibana-key.pem
chmod 600 kibana-key.pem
💡 輸入相關資訊:
在執行上述指令時,OpenSSL 會要求輸入一些資訊,像是:
- Country Name (國家代碼):TW
- State or Province Name (省/市):Taipei
- Locality Name (城市):Taipei
- Organization Name (公司名稱):momo.com
- Common Name (CN):apielkmonitor.momoshop.com.tw
Country Name (2 letter code) [AU]:TW
State or Province Name (full name) [Some-State]:Taipei
Locality Name (eg, city) []:Taipei
Organization Name (eg, company) [Internet Widgits Pty Ltd]:momo.com
Organizational Unit Name (eg, section) []:
Common Name (e.g. server FQDN or YOUR name) []:apielkmonitor.momoshop.com.tw
Email Address []:srou@fmt.com.tw
🎯 產生的檔案:
- kibana-cert.pe:私鑰
- kibana-cert.pe:自簽名憑證
🚀 步驟 2:配置 Kibana 使用 HTTPS
🔧 編輯 Kibana 的設定檔 kibana.yml:
打開 kibana.yml 檔案(通常位於 /etc/kibana/kibana.yml 或你的安裝目錄下),修改以下內容:
# 啟用 SSL
server.ssl.enabled: true

# 設定 SSL 憑證和私鑰的路徑
server.ssl.certificate: /etc/kibana/ssl/kibana-crt.pem
server.ssl.key: /etc/kibana/ssl/kibana-key.pem
# 修改 Kibana 的監聽端口
server.port: 443


# 如果elasticsearch 使用ssl 連線(沒有則不用)
# 選擇驗證證書的方式
elasticsearch.ssl.verificationMode: full
# 這個證書在 Elasticsearch 的 HTTP 證書時已經生成。複製到 Kibana 安裝目錄下配置使用即可。
elasticsearch.ssl.certificateAuthorities: [ "/data/kibana-8.13.0/elasticsearch-ca.pem" ]
⚠️ 注意:將
/path/to/替換成你實際的憑證路徑。
🚀 步驟 3:允許本機信任自簽名憑證
🖥️ Mac 或 Linux:
將自簽名憑證 kibana.crt 匯入你的系統信任區:
sudo cp kibana.crt /usr/local/share/ca-certificates/kibana.crt
sudo update-ca-certificates
🖥️ Windows:
- 打開 證書管理。
- 選擇 受信任的根憑證授權單位。
- 匯入 kibana.crt 檔案。
🚀 步驟 4:重啟 Kibana
sudo systemctl restart kibana
🎯 步驟 5:透過 HTTPS 訪問 Kibana
現在,你可以使用 https://localhost(或指定的 IP 地址)來訪問 Kibana。
錯誤處理:
FATAL Error: listen EACCES: permission denied 0.0.0.0:443
-
# 啟動服務錯誤
sudo systemctl start kibana
# 可以使用以下語法查看詳細錯誤
journalctl -u kibana -f

#如果出現以下錯誤,代表不允許非root人員啟用1024 port 以下服務
FATAL  Error: listen EACCES: permission denied 0.0.0.0:443

#使用以下語法同意以下檔案綁定使用1024 port 以下服務
setcap cap_net_bind_service=+epi /usr/share/kibana/bin/kibana
setcap cap_net_bind_service=+epi /usr/share/kibana/bin/kibana-plugin
setcap cap_net_bind_service=+epi /usr/share/kibana/bin/kibana-keystore
# node以實際位置為主
setcap cap_net_bind_service=+epi /usr/share/kibana/node/glibc-217/bin/node
Error: EACCES: permission denied, open '/run/kibana/kibana.pid'
chown kibana:kibana /run/kibana/kibana.pid
setcap cap_net_bind_service=+epi /run/kibana/kibana.pid
【 錯誤處理】watermark 設定太小導致index 變成唯讀
Log 出現:
filebeat-7.17.7-app-integrity-ap-prod-2025.11.09] blocked by: [TOO_MANY_REQUESTS/12/disk usage exceeded flood-stage watermark, index has read-only-allow-delete block];
以下是 Elasticsearch 出現 flood-stage watermark(磁碟使用率過高)導致 index 變成 read-only-allow-delete 的完整處理方式(你目前的錯誤訊息就是這個觸發的)。
✅ 錯誤原因
你的 Filebeat / Logstash 嘗試寫入索引filebeat-7.7-app-integrity-ap-prod-2025.11.09
但 Elasticsearch 回覆:
blocked by: [TOO_MANY_REQUESTS/12/disk usage exceeded flood-stage watermark, index has read-only-allow-delete block]
這代表:
-
磁碟使用量超過 ES flood-stage watermark(預設 95%)
-
ES 自己把 index 設成 唯讀(read-only-allow-delete)
-
所有寫入都會 429 / 403
ES 為了保護資料,所以禁止寫入。
✅ 解決方式
Step 1:檢查磁碟使用率
df -h
如果你看到 /var/lib/elasticsearch 所在的分區超過 95%,你要先:
-
清舊 index
-
增加磁碟空間
-
或移動 data path
Step 2:刪除舊 index(最常見處理方式)
例如刪除 90 天前的索引:
curl -X DELETE "http://localhost:9200/filebeat-*-2025.08.*"
或手動刪除:
curl -X DELETE "http://localhost:9200/filebeat-7.7-momo-app-integrity-ap-prod-2025.11.09"
💡你可以先查看所有索引大小:
curl -X GET "http://localhost:9200/_cat/indices?v&h=index,store.size"
Step 3:解除 ES 的 read-only 保護
即使磁碟清乾淨了,ES 還是會記住 read-only block
要自己取消
對所有 index:
curl -X PUT "http://localhost:9200/_all/_settings" -H 'Content-Type: application/json' -d'
{
  "index.blocks.read_only_allow_delete": null
}
'
或指定某個 index:
curl -X PUT "http://localhost:9200/filebeat-7.7-momo-app-integrity-ap-prod-2025.11.09/_settings" \
-H 'Content-Type: application/json' -d'
{
  "index.blocks.read_only_allow_delete": null
}
'
Step 4(建議):調整 ES Watermark 避免一直被鎖
例如:
curl -X PUT "http://localhost:9200/_cluster/settings" \
-H 'Content-Type: application/json' -d'
{
  "persistent": {
    "cluster.routing.allocation.disk.watermark.low": "80%",
    "cluster.routing.allocation.disk.watermark.high": "90%",
    "cluster.routing.allocation.disk.watermark.flood_stage": "95%",
    "cluster.info.update.interval": "1m"
  }
}
'
Step 5(可選):手動清理 translog
如果 ES 卡住很久,也可以清理 translog:
curl -X POST "localhost:9200/filebeat-*/_flush"
🔍 最快解法(給你直接用)
-
刪舊 index
-
解除 read-only
curl -X PUT "http://localhost:9200/_all/_settings" \
-H 'Content-Type: application/json' -d'
{
  "index.blocks.read_only_allow_delete": null
}
'
-
恢復 Filebeat 寫入
✅ 什麼是 Watermark?
Elasticsearch 預設會監控 data 目錄所在磁碟使用率:
| Name | 意義 | 預設值 | 行為 |
|---|---|---|---|
| low watermark | 開始重新 routing shard | 85% | 輕警告 |
| high watermark | 停止將新 shard 分配到該節點 | 90% | 停止新增 shard |
| flood-stage watermark | 把 index 改成唯讀 | 95% | 造成 read-only-allow-delete |
你的錯誤訊息就是因為 flood-stage 達標。
✅ 修改 Watermark(官方標準方式)
👉 調整 Watermark 百分比
以下 API 會直接套用在整個 cluster:
curl -X PUT "http://localhost:9200/_cluster/settings" \
-H 'Content-Type: application/json' -d'
{
  "persistent": {
    "cluster.routing.allocation.disk.watermark.low": "80%",
    "cluster.routing.allocation.disk.watermark.high": "90%",
    "cluster.routing.allocation.disk.watermark.flood_stage": "95%",
    "cluster.info.update.interval": "1m"
  }
}
'
三個參數的用途:
-
"low": "80%"
80% 才開始觸發 routing -
"high": "90%"
90% 以上 ES 不會在該 node 分配新的 shard -
"flood_stage": "95%"
超過 95% ES 會鎖 index → read-only
✅ 調整成更寬鬆(如果磁碟常滿)建議這組:
你可以把 flood_stage 往上調,比如 98% 或 99%:
curl -X PUT "http://localhost:9200/_cluster/settings" \
-H 'Content-Type: application/json' -d'
{
  "persistent": {
    "cluster.routing.allocation.disk.watermark.low": "85%",
    "cluster.routing.allocation.disk.watermark.high": "92%",
    "cluster.routing.allocation.disk.watermark.flood_stage": "98%",
    "cluster.info.update.interval": "30s"
  }
}
'
💡 若是單機環境(非 cluster),98% 是最常見的設定。
⚠️ 另一種方式:改用「磁碟剩餘容量 (free bytes)」而不是百分比
例如磁碟剩下 10GB 才鎖 index:
curl -X PUT "http://localhost:9200/_cluster/settings" \
-H 'Content-Type: application/json' -d'
{
  "persistent": {
    "cluster.routing.allocation.disk.watermark.low": "10gb",
    "cluster.routing.allocation.disk.watermark.high": "5gb",
    "cluster.routing.allocation.disk.watermark.flood_stage": "2gb"
  }
}
'
這種方式比較直覺、不怕磁碟變大或變小。
🚨 注意:調整 Watermark 不會解除 index 的 read-only
如果某些 index 已經被鎖,需要再解除:
curl -X PUT "http://localhost:9200/_all/_settings" \
-H 'Content-Type: application/json' -d'
{
  "index.blocks.read_only_allow_delete": null
}
'
或指定某個 index:
curl -X PUT "http://localhost:9200/filebeat-*/_settings" \
-H 'Content-Type: application/json' -d'
{
  "index.blocks.read_only_allow_delete": null
}
'
查看所有 index 大小:
curl -X GET "http://localhost:9200/_cat/indices?v&h=index,store.size"
【參數說明】enable_for_single_data_node
下面我會用 最清楚、最貼近你現在 ES 架構的方式 解釋enable_for_single_data_node 是什麼、什麼時候要開/關、會影響什麼。
⭐ 1. enable_for_single_data_node 是什麼?
這是一個 Elasticsearch 控制 Watermark 是否要啟用於單節點(Single Data Node)環境的設定。
完整參數名稱:
cluster.routing.allocation.disk.watermark.enable_for_single_data_node
它的作用:
如果你的 Elasticsearch 只有 1 台 node(單機 ES),是否也要套用磁碟 watermark 限制?
⭐ 2. 為什麼會有這個設定?
因為 Elasticsearch 原本的 watermark 行為(low / high / flood_stage)是為 多節點 cluster 設計的。
但如果你是:
✔ 單機 Elasticsearch
✔ 沒有第二台 node 可以搬 shard
那就會出現很尷尬的情況:
一旦磁碟超過 watermark(例如 high 90%)
ES 想搬 shard……
但根本沒有其他 node 能搬
然後 ES 就會把 shard 標成 UNASSIGNED
或直接鎖住 index(Read-only)
這在單機 ES 是「不合理且災難級別的行為」。
所以 ES 才加入這個參數:
⭐ 3. 功能用一句話總結
👉 如果設定成 true
即使你只有 1 台 Elasticsearch,也會啟用 watermark(high / flood_stage 等)。
👉 如果設定成 false
單機 ES 忽略 high watermark(不阻止分配 shard)
但 flood_stage(95%)還是會強制生效(避免你把磁碟寫爆)
⭐ 4. 預設值是?(重點)
版本差異:
| Elasticsearch 版本 | 預設值 | 說明 |
|---|---|---|
| 7.x | false |
單機不啟用 high watermark |
| 8.x | true |
單機也啟用完整 watermark 機制 |
如果你看到是 true,通常代表:
✔ 你是 ES 8.x
✔ 或你用了 hot/warm/cold/frozen 層級
✔ 或你用到 searchable snapshots
⭐ 5. 那你應該設 true 還是 false?(最重要)
✔ 如果你是 單機 Elasticsearch(只有 1 台)
我建議:
cluster.routing.allocation.disk.watermark.enable_for_single_data_node": false
理由:
-
避免 high watermark(90%)直接禁止 shard 分配
-
避免 index 提前 read-only
-
避免 cluster 假性「red/yellow」狀態
-
單機沒必要用 cluster-style routing
但 flood_stage 仍然會保護你避免磁碟爆滿。
這是 單機 ES 正常、合理、安全 的設定。
✔ 如果你是 真正的多節點 cluster(>= 2 data node)
你應該保留 true
讓 ES 正常做 shard relocation。
⭐ 6. 單行解釋(你可以放到備忘):
enable_for_single_data_node = false → 單機不要限制太多,不要亂搬 shard
enable_for_single_data_node = true → 多機需要完整 watermark 保護
⭐ 7. 你現在的情況(結論)
根據你前面截圖:
你有 frozen、watermark、read-only、filebeat 等狀況
高度機率你是單機 or 少數機器的 ES
所以:
"cluster.routing.allocation.disk.watermark.enable_for_single_data_node": "true"
會讓 ES:
❌ 必須搬 shard
❌ 但沒地方搬
❌ 於是高水位直接阻斷分配
❌ 然後 ES 把 index 鎖成 read-only
❌ 造成 filebeat 錯誤
你就會看到「設定無效」、「read-only-allow-delete」、「flood-stage」等問題。
⭐ 給你正確的單機 ES 設定模板(最穩定、不會鎖 index)
PUT _cluster/settings
{
  "persistent": {
    "cluster.routing.allocation.disk.watermark.low": "10gb",
    "cluster.routing.allocation.disk.watermark.high": "5gb",
    "cluster.routing.allocation.disk.watermark.flood_stage": "2gb",

    "cluster.routing.allocation.disk.watermark.enable_for_single_data_node": "false",

    "cluster.routing.allocation.disk.watermark.low.frozen": null,
    "cluster.routing.allocation.disk.watermark.high.frozen": null,
    "cluster.routing.allocation.disk.watermark.flood_stage.frozen": null,
    "cluster.routing.allocation.disk.watermark.low.frozen.max_headroom": null,
    "cluster.routing.allocation.disk.watermark.high.frozen.max_headroom": null,
    "cluster.routing.allocation.disk.watermark.flood_stage.frozen.max_headroom": null
  }
}
如果你願意
貼下面這段,我可以直接判斷你該用 true 或 false:
GET _cat/nodes?v
或
GET _cluster/settings?include_defaults=true&pretty
我可以直接比對你的 cluster 架構(單機/多機)給你最適設定。
【常用指令】kibana Dev Tools
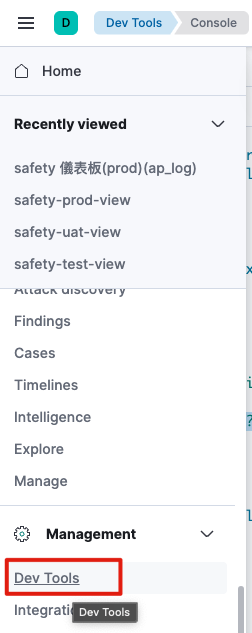
#  查看設定
GET /_cluster/settings?include_defaults=true&pretty