# Grafana & Prometheus
# Grafana_install
[https://fanatical-dentist-b1d.notion.site/Grafana-b93a5178e6a64bad886b83fd6bdcf4ea](https://fanatical-dentist-b1d.notion.site/Grafana-b93a5178e6a64bad886b83fd6bdcf4ea)
Enterprise
```INI
[grafana]
name=grafana
baseurl=https://packages.grafana.com/enterprise/rpm
repo_gpgcheck=1
enabled=1
gpgcheck=1
gpgkey=https://packages.grafana.com/gpg.key
sslverify=1
sslcacert=/etc/pki/tls/certs/ca-bundle.crt
```
OSS
```INI
[grafana]
name=grafana
baseurl=https://packages.grafana.com/oss/rpm
repo_gpgcheck=1
enabled=1
gpgcheck=1
gpgkey=https://packages.grafana.com/gpg.key
sslverify=1
sslcacert=/etc/pki/tls/certs/ca-bundle.crt
```
install
```shell
sudo yum install grafana
# install zabbix plugin
grafana-cli plugins install alexanderzobnin-zabbix-app
```
# Actuator+Prometheus+Grafana監控視覺化簡介
[https://www.tpisoftware.com/tpu/articleDetails/2446](https://www.tpisoftware.com/tpu/articleDetails/2446)
pom.xml 需增加以下依賴:
```XML
org.springframework.boot
spring-boot-starter-actuator
io.micrometer
micrometer-registry-prometheus
```
```INI
#management.endpoint.health.show-details=ALWAYS
#management.endpoints.web.base-path=/monitor
management.endpoints.web.exposure.include=prometheus,metrics
```
- Prometheus 快速入门教程(六):Spring Boot Actuator 实现应用监控
[https://www.cnblogs.com/chanshuyi/p/06\_prometheus\_with\_springboot\_actuator.html](https://www.cnblogs.com/chanshuyi/p/06_prometheus_with_springboot_actuator.html)
- Spring Boot 微服務應用整合Prometheus + Grafana 實現監控告警
[https://juejin.cn/post/6844904052417904653](https://juejin.cn/post/6844904052417904653)
- spring-prometheus的指標意義
[https://blog.csdn.net/ssehs/article/details/123961221](https://blog.csdn.net/ssehs/article/details/123961221)
- prometheus 使用netdata 資料
[https://learn.netdata.cloud/docs/exporting-metrics/prometheus#configure-prometheus-to-scrape-netdata-metrics](https://learn.netdata.cloud/docs/exporting-metrics/prometheus#configure-prometheus-to-scrape-netdata-metrics)
# Grafana alerting
https://www.cnblogs.com/liugp/p/17003484.html
# Grafana 下拉選單(prometheus)
[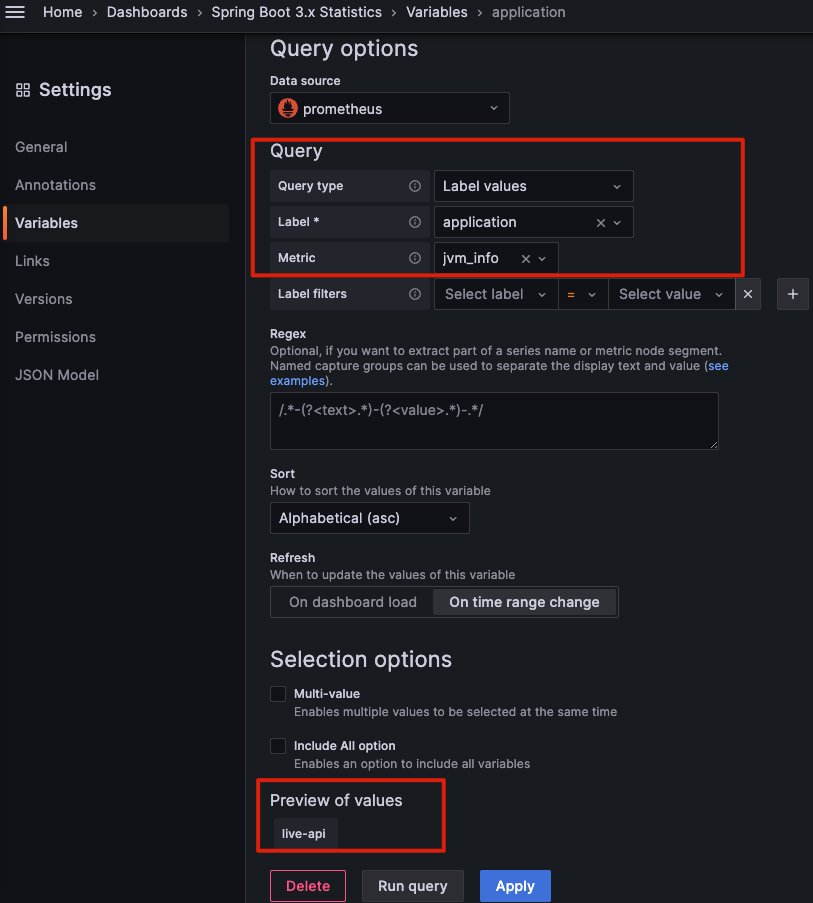](https://bookstack.treemanou.com/uploads/images/gallery/2024-02/3ai42qyKTzETIpE3-image-1709185419013.png)
prometheus
[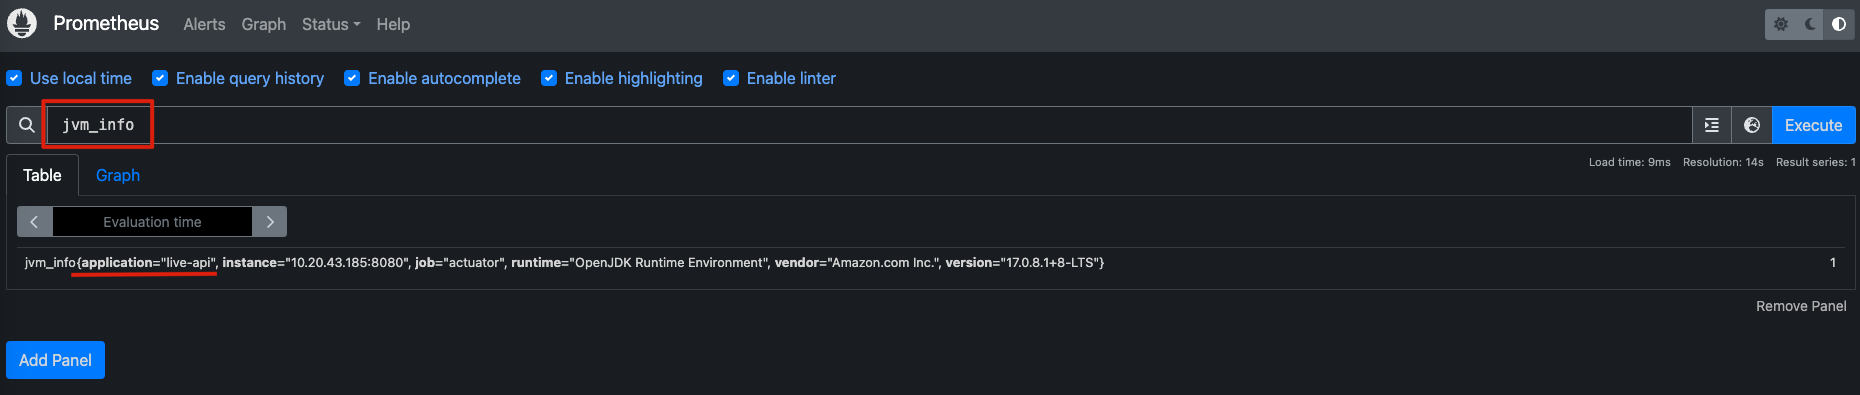](https://bookstack.treemanou.com/uploads/images/gallery/2024-02/M97jqpmykl8A84mR-image-1709185498384.png)
prometheus 設定檔,新增自訂label
[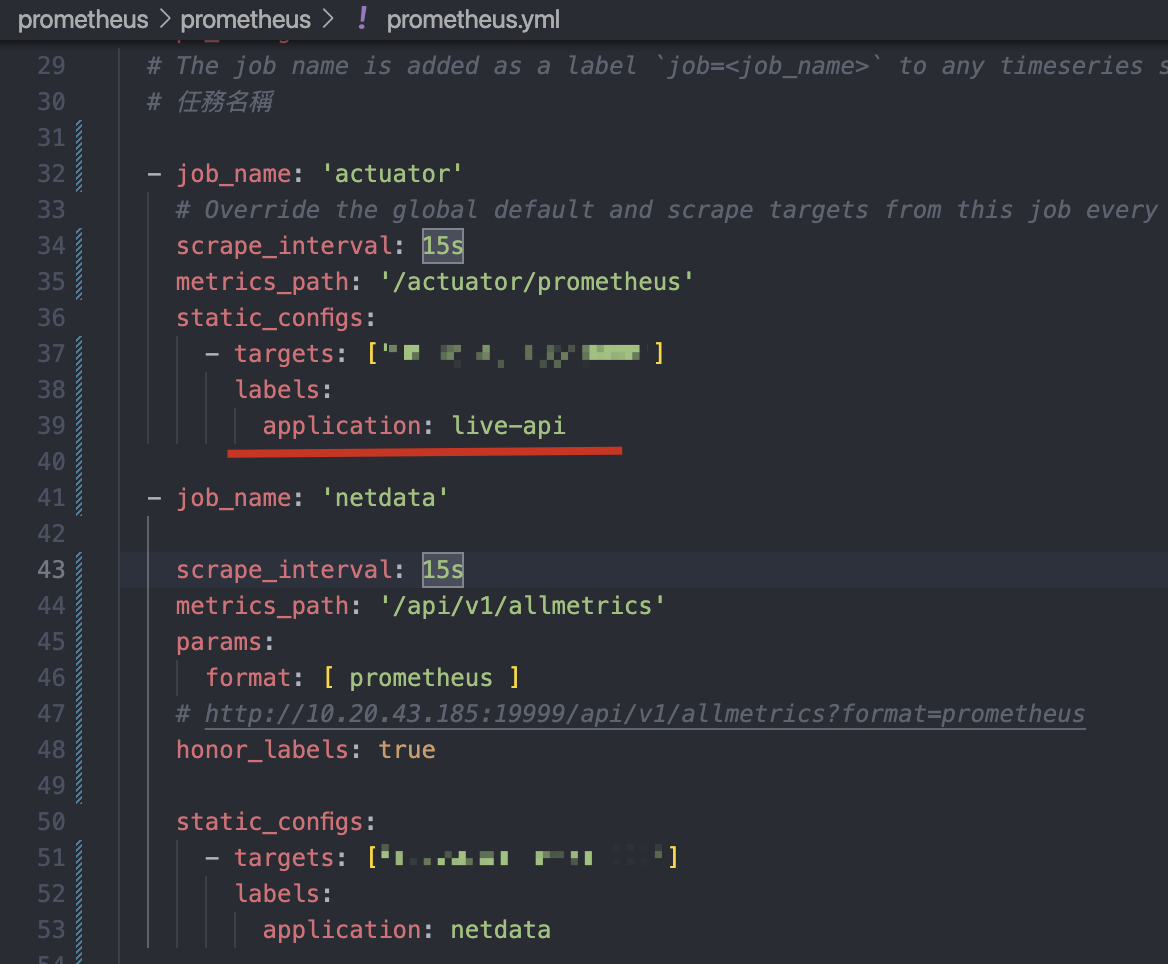](https://bookstack.treemanou.com/uploads/images/gallery/2024-02/VNvJW7urVXNHKC10-image-1709185606695.png)
# Prometheus 相關資源
- [官方範例設定檔](https://github.com/prometheus/prometheus/blob/release-2.50/config/testdata/conf.good.yml)
- [prometheus-book](https://yunlzheng.gitbook.io/prometheus-book/parti-prometheus-ji-chu/alert)
- [prometheus實戰](https://songjiayang.gitbooks.io/prometheus/content/)
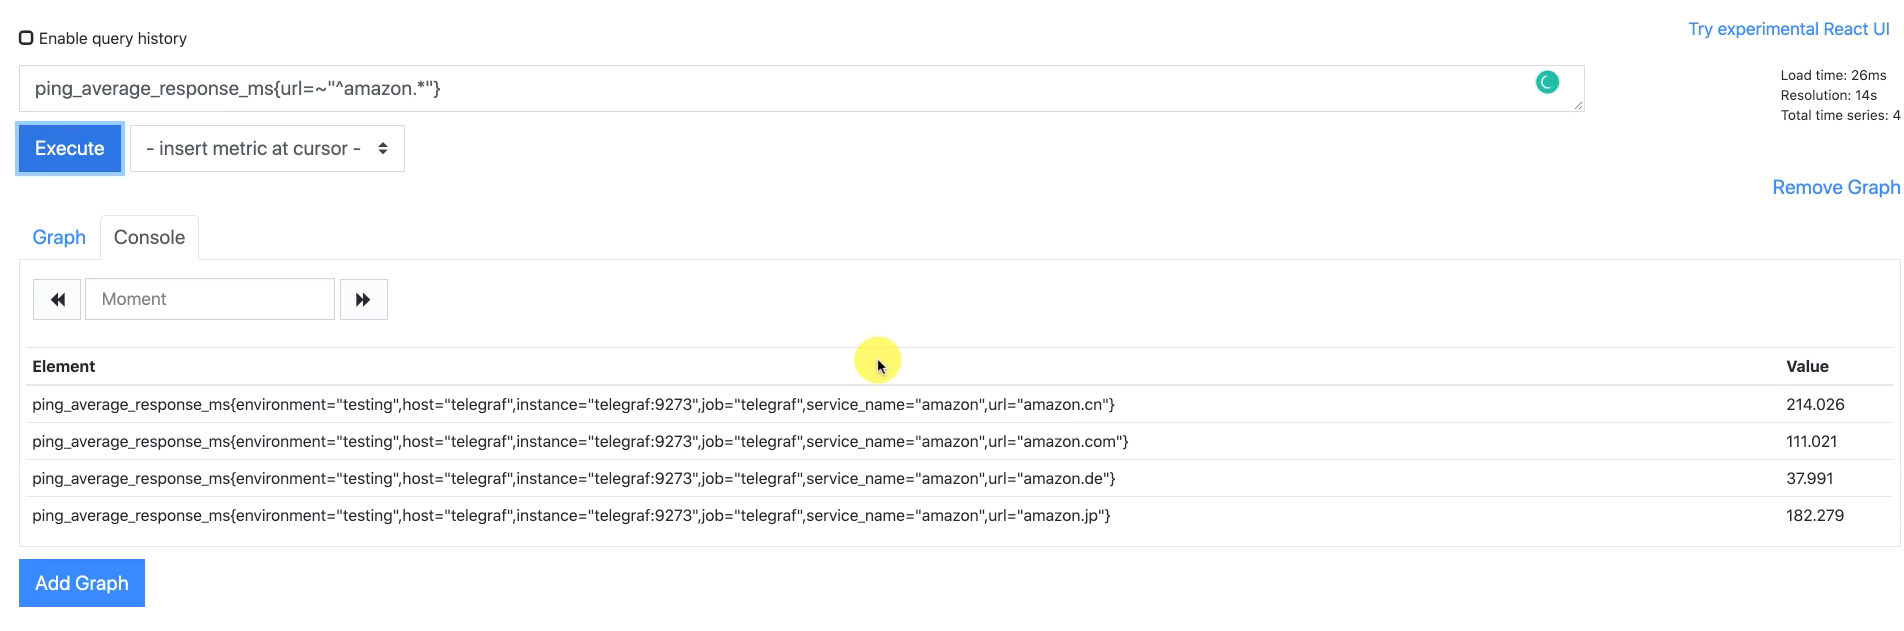
# Prometheus PromQL
[](https://bookstack.treemanou.com/uploads/images/gallery/2024-03/iCarZJaclwkXMPXT-image-1710164090550.png)
[](https://bookstack.treemanou.com/uploads/images/gallery/2024-03/Ga8vgsEYE3ymwYsm-image-1710164264802.png)
[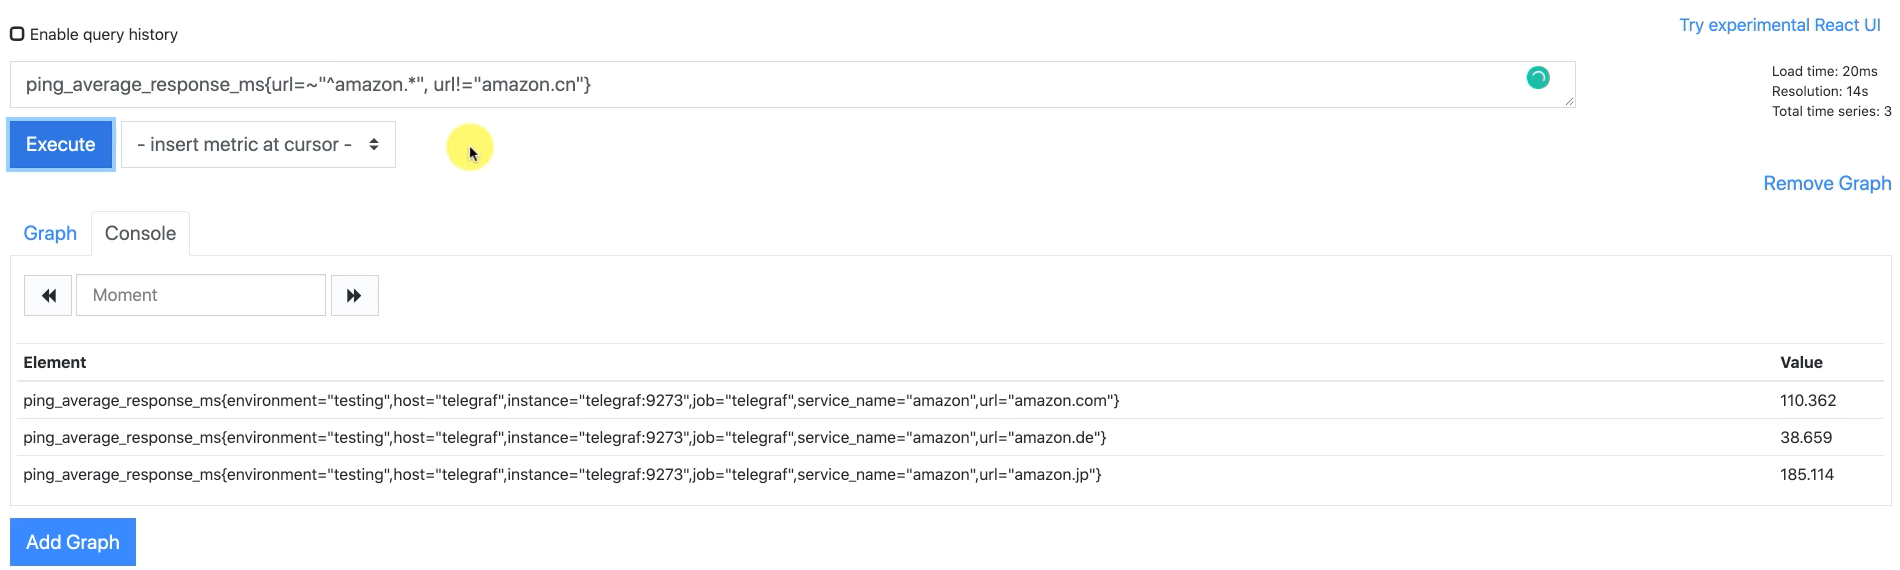](https://bookstack.treemanou.com/uploads/images/gallery/2024-03/Qpjr6qPv2hchWi5f-image-1710164314644.png)
[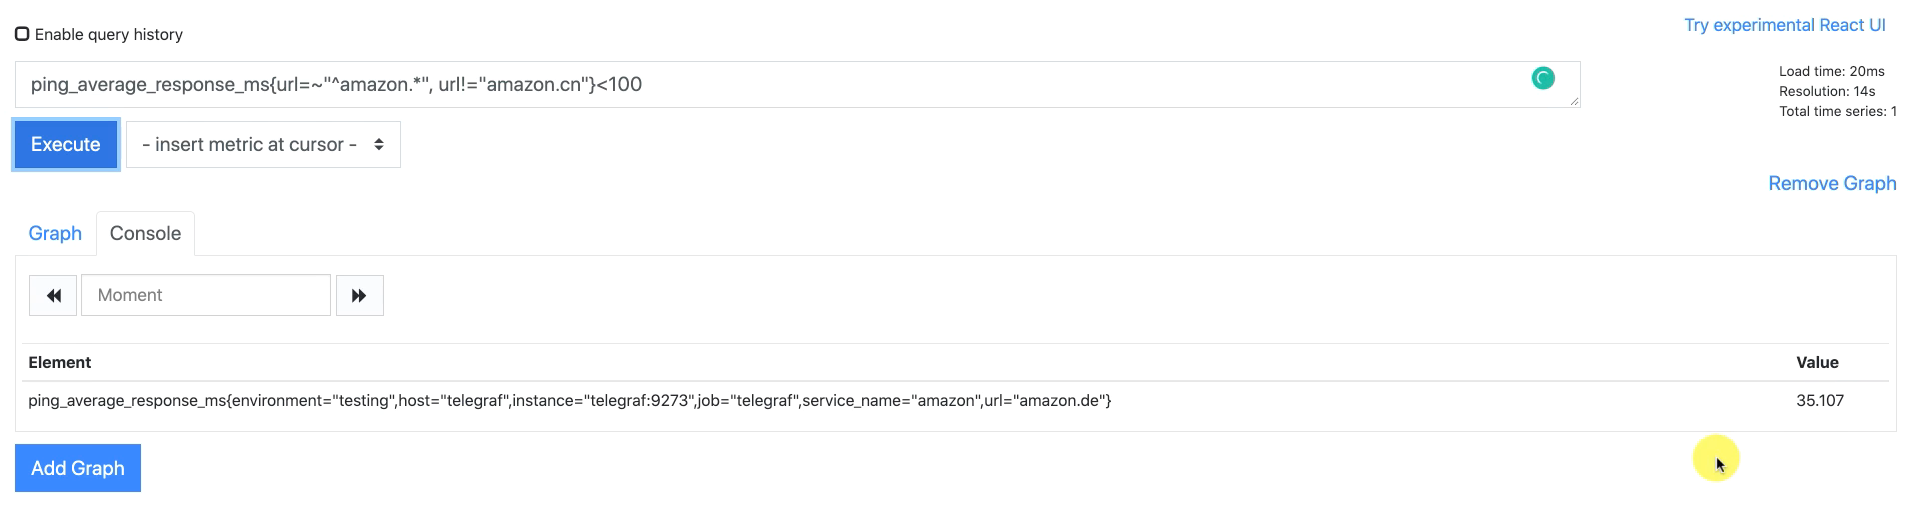](https://bookstack.treemanou.com/uploads/images/gallery/2024-03/7XXg6uSgUzGsYk7O-image-1710164366437.png)
[](https://bookstack.treemanou.com/uploads/images/gallery/2024-03/1Swc4xYQPi2GGlBn-image-1710164466436.png)
[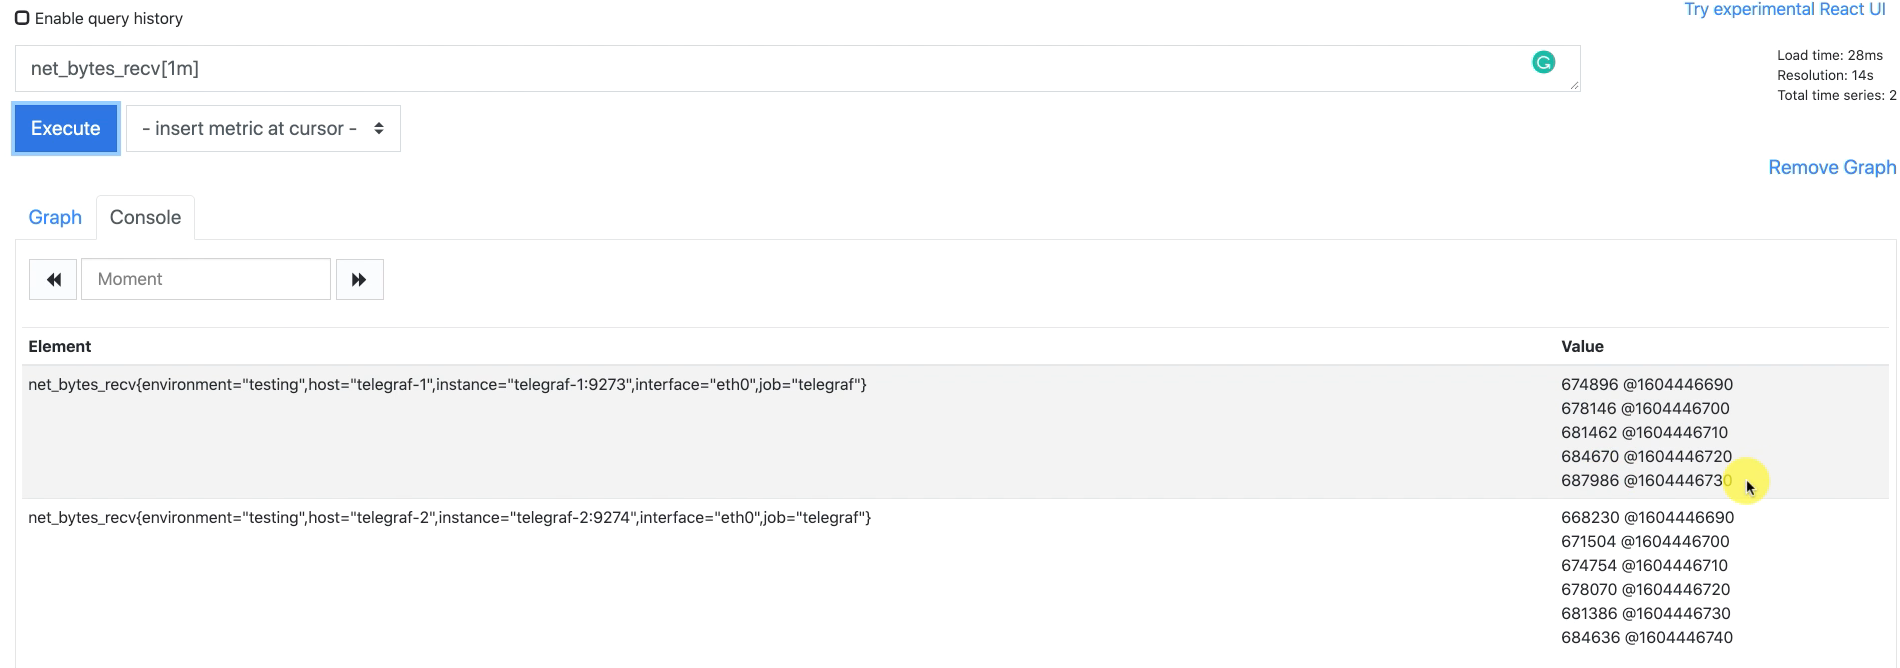](https://bookstack.treemanou.com/uploads/images/gallery/2024-03/mDjlyAKYXHqsw5Pb-image-1710164634100.png)
[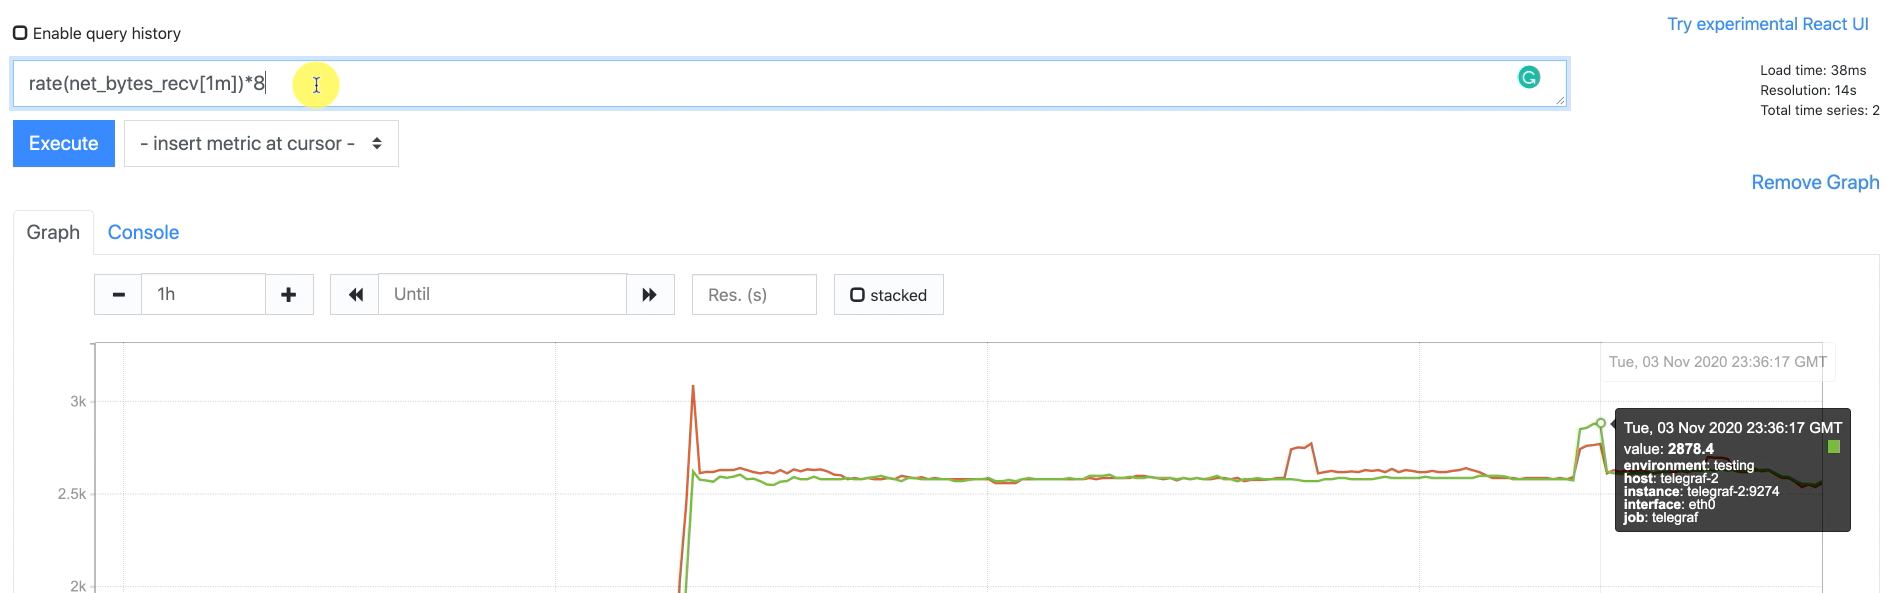](https://bookstack.treemanou.com/uploads/images/gallery/2024-03/f70CxPHHnKTCYCC6-image-1710164902975.png)
[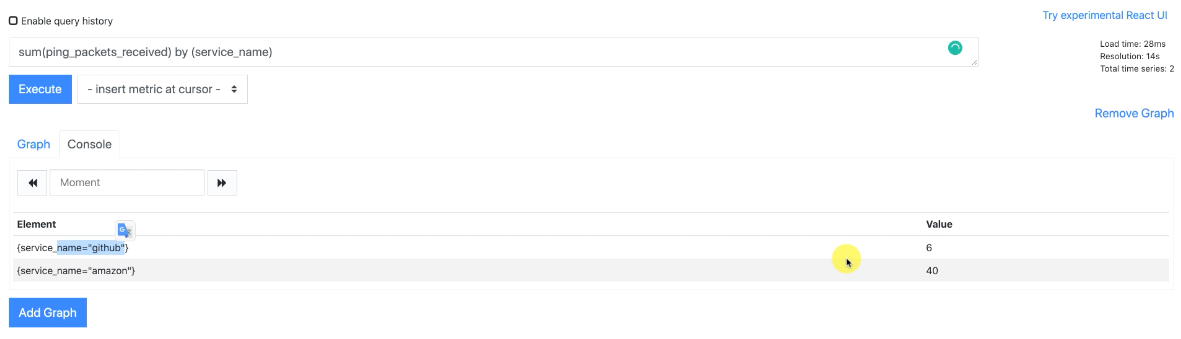](https://bookstack.treemanou.com/uploads/images/gallery/2024-03/wYe5BlPGUVQpqS6j-image-1710165243618.png)
# Grafana_Promethues docker-compose
```YAML
version: '3.3'
volumes:
prometheus_data: {}
grafana_data: {}
networks:
monitoring:
driver: bridge
services:
prometheus:
image: prom/prometheus
container_name: prometheus
restart: always
volumes:
- /etc/localtime:/etc/localtime:ro
- ./prometheus/:/etc/prometheus/
- prometheus_data:/prometheus
command:
- '--config.file=/etc/prometheus/prometheus.yml'
- '--storage.tsdb.path=/prometheus'
- '--web.console.libraries=/usr/share/prometheus/console_libraries'
- '--web.console.templates=/usr/share/prometheus/consoles'
networks:
- monitoring
# links:
# - alertmanager
# - node_exporter
expose:
- '9090'
ports:
- 9090:9090
# alertmanager:
# image: prom/alertmanager
# container_name: alertmanager
# restart: always
# volumes:
# - /etc/localtime:/etc/localtime:ro
# - ./alertmanager/:/etc/alertmanager/
# command:
# - '--config.file=/etc/alertmanager/config.yml'
# - '--storage.path=/alertmanager'
# networks:
# - monitoring
# expose:
# - '9093'
# ports:
# - 9099:9093
# node_exporter 為了能夠采集到主機的運行指標如CPU, 內存,磁盤
# node_exporter:
# image: prom/node-exporter:v0.18.0
# container_name: node_exporter
# restart: always
# volumes:
# - /etc/localtime:/etc/localtime:ro
# - /proc:/host/proc:ro
# - /sys:/host/sys:ro
# - /:/rootfs:ro
# command:
# - '--path.procfs=/host/proc'
# - '--path.sysfs=/host/sys'
# - --collector.filesystem.ignored-mount-points
# - "^/(sys|proc|dev|host|etc|rootfs/var/lib/docker/containers|rootfs/var/lib/docker/overlay2|rootfs/run/docker/netns|rootfs/var/lib/docker/aufs)($$|/)"
# networks:
# - monitoring
# expose:
# - '9100'
grafana:
image: grafana/grafana
user: "472"
container_name: grafana
restart: always
environment:
GF_SECURITY_ADMIN_PASSWORD: admin
volumes:
- /etc/localtime:/etc/localtime:ro
- ./grafana/grafana_data:/var/lib/grafana
- ./grafana/provisioning/:/etc/grafana/provisioning/
# env_file:
# - ./grafana/config.monitoring
networks:
- monitoring
links:
- prometheus
ports:
- 3000:3000
depends_on:
- prometheus
```
```YAML
version: "3.7"
services:
db:
image: postgres:13.2-alpine
restart: always
environment:
POSTGRES_DB: postgres
POSTGRES_USER: postgres #postgres
POSTGRES_PASSWORD: 12345678 #1234
PGDATA: /var/lib/postgresql/data
volumes:
- ./data/db:/var/lib/postgresql/data
ports:
- "5432:5432"
# pgadmin:
# image: dpage/pgadmin4:latest
# restart: always
# environment:
# PGADMIN_DEFAULT_EMAIL: admin@fmt.com.tw #xxx@gmail
# PGADMIN_DEFAULT_PASSWORD: 12345678 #abcd
# PGADMIN_LISTEN_PORT: 80
# ports:
# - "5433:80"
# volumes:
# - ./data/pgadmin-data:/var/lib/pgadmin
# - ./data/upload:/tmp/upload
# links:
# - "db:pgsql-server"
volumes:
db-data:
pgadmin-data:
```