k8s 監控
集群資源監控
1. 監控指標
-
集群監控
- 節點資源利用率
- 節點數量
- 運行的 Pods
-
Pod 監控
- 容器指標
- 應用程序
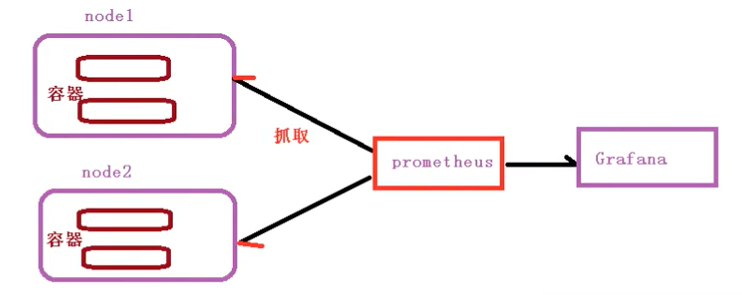
2. 監控平台搭建方案:Prometheus + Grafana
(1) Prometheus
- 開源的
- 具備監控、報警、數據庫功能
- 以 HTTP 協議定期抓取被監控組件的狀態
- 不需要複雜的集成過程,使用 HTTP 接口接入即可
(2) Grafana
- 開源的數據分析和可視化工具
- 支援多種數據源
# rbac-setup.yaml
apiGroups: ["*"]
resources:
  - nodes
  - nodes/proxy
  - services
  - endpoints
  - pods
verbs: ["get", "list", "watch"]
---
apiGroups:
  - extensions
resources:
  - ingresses
verbs: ["get", "list", "watch"]
nonResourceURLs: ["/metrics"]
verbs: ["get"]
---
apiVersion: v1
kind: ServiceAccount
metadata:
  name: prometheus
  namespace: kube-system
---
apiVersion: rbac.authorization.k8s.io/v1
kind: ClusterRoleBinding
metadata:
  name: prometheus
roleRef:
  apiGroup: rbac.authorization.k8s.io
  kind: ClusterRole
  name: prometheus
subjects:
  - kind: ServiceAccount
    name: prometheus
    namespace: kube-system